An agent to measure your LinkedIn Ads impact
Every marketer running LinkedIn Ads eventually has to answer one question: What’s the ROI of our ads?
Every marketer running LinkedIn Ads eventually has to answer one question: What’s the ROI of our ads?
The problem is that clicks don’t tell the full story. A potential buyer could see your ads several times, never click, and still be influenced by them when they decide to buy.
This happens all the time with LinkedIn Ads. Your ads may be effective, but they don’t show up in your analytics. Instead, the deal gets attributed to organic or direct traffic. And that’s when attribution starts becoming a debate between marketers and CEOs.
I built a simple agent that creates a report to help solve this problem.
It first pulls the LinkedIn impression data, then pulls the HubSpot deal data, and finally creates a timeline showing when companies started seeing your ads and when they entered your pipeline.
This way, you can see when companies started seeing your ads, when they entered your pipeline, and compare the sales cycle of deals where companies were exposed to ads versus deals where they were not.
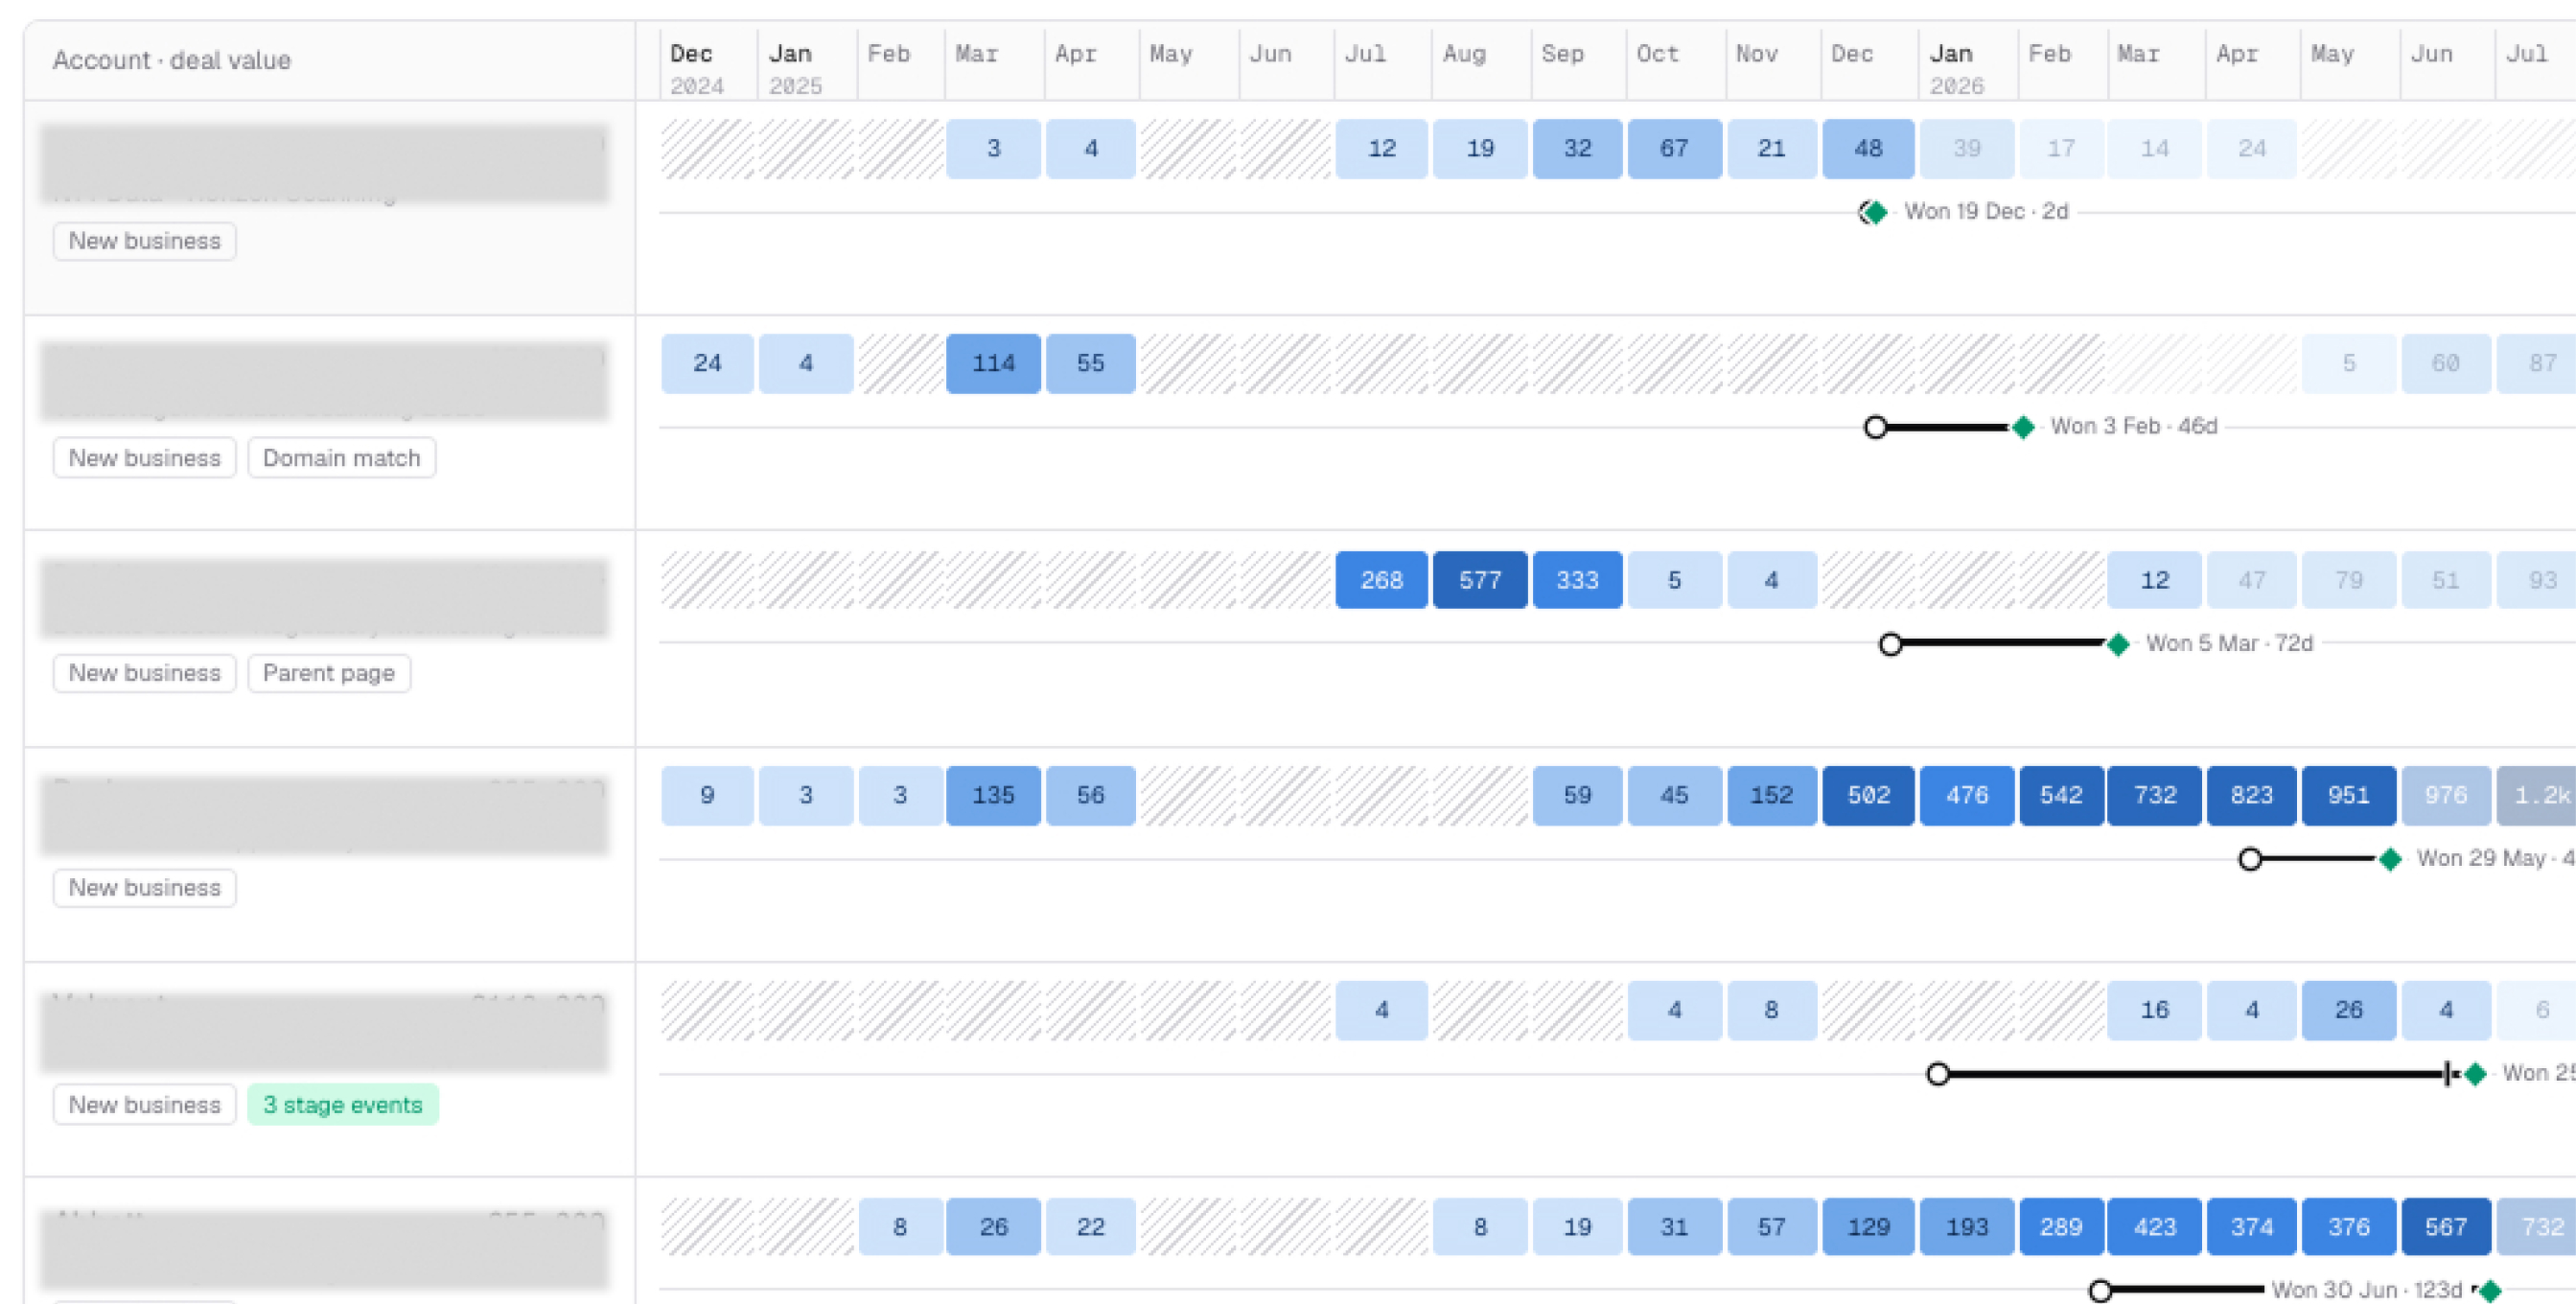
It’s simple, yet it helps answer one of the most pressing questions CEOs ask marketers.
Here is how I built it 🔧
Step 1 - The Agent Pulls LinkedIn Impression Data
I want to know how many ad impressions each company gets every week.
To do this, you need to make one API call per week.
Imagine going to the good ol’ Professional Demographics report, filtering by company, and setting the timeframe to one week. Export it, move to the next week, export again, and repeat. You get the drill. 🙂
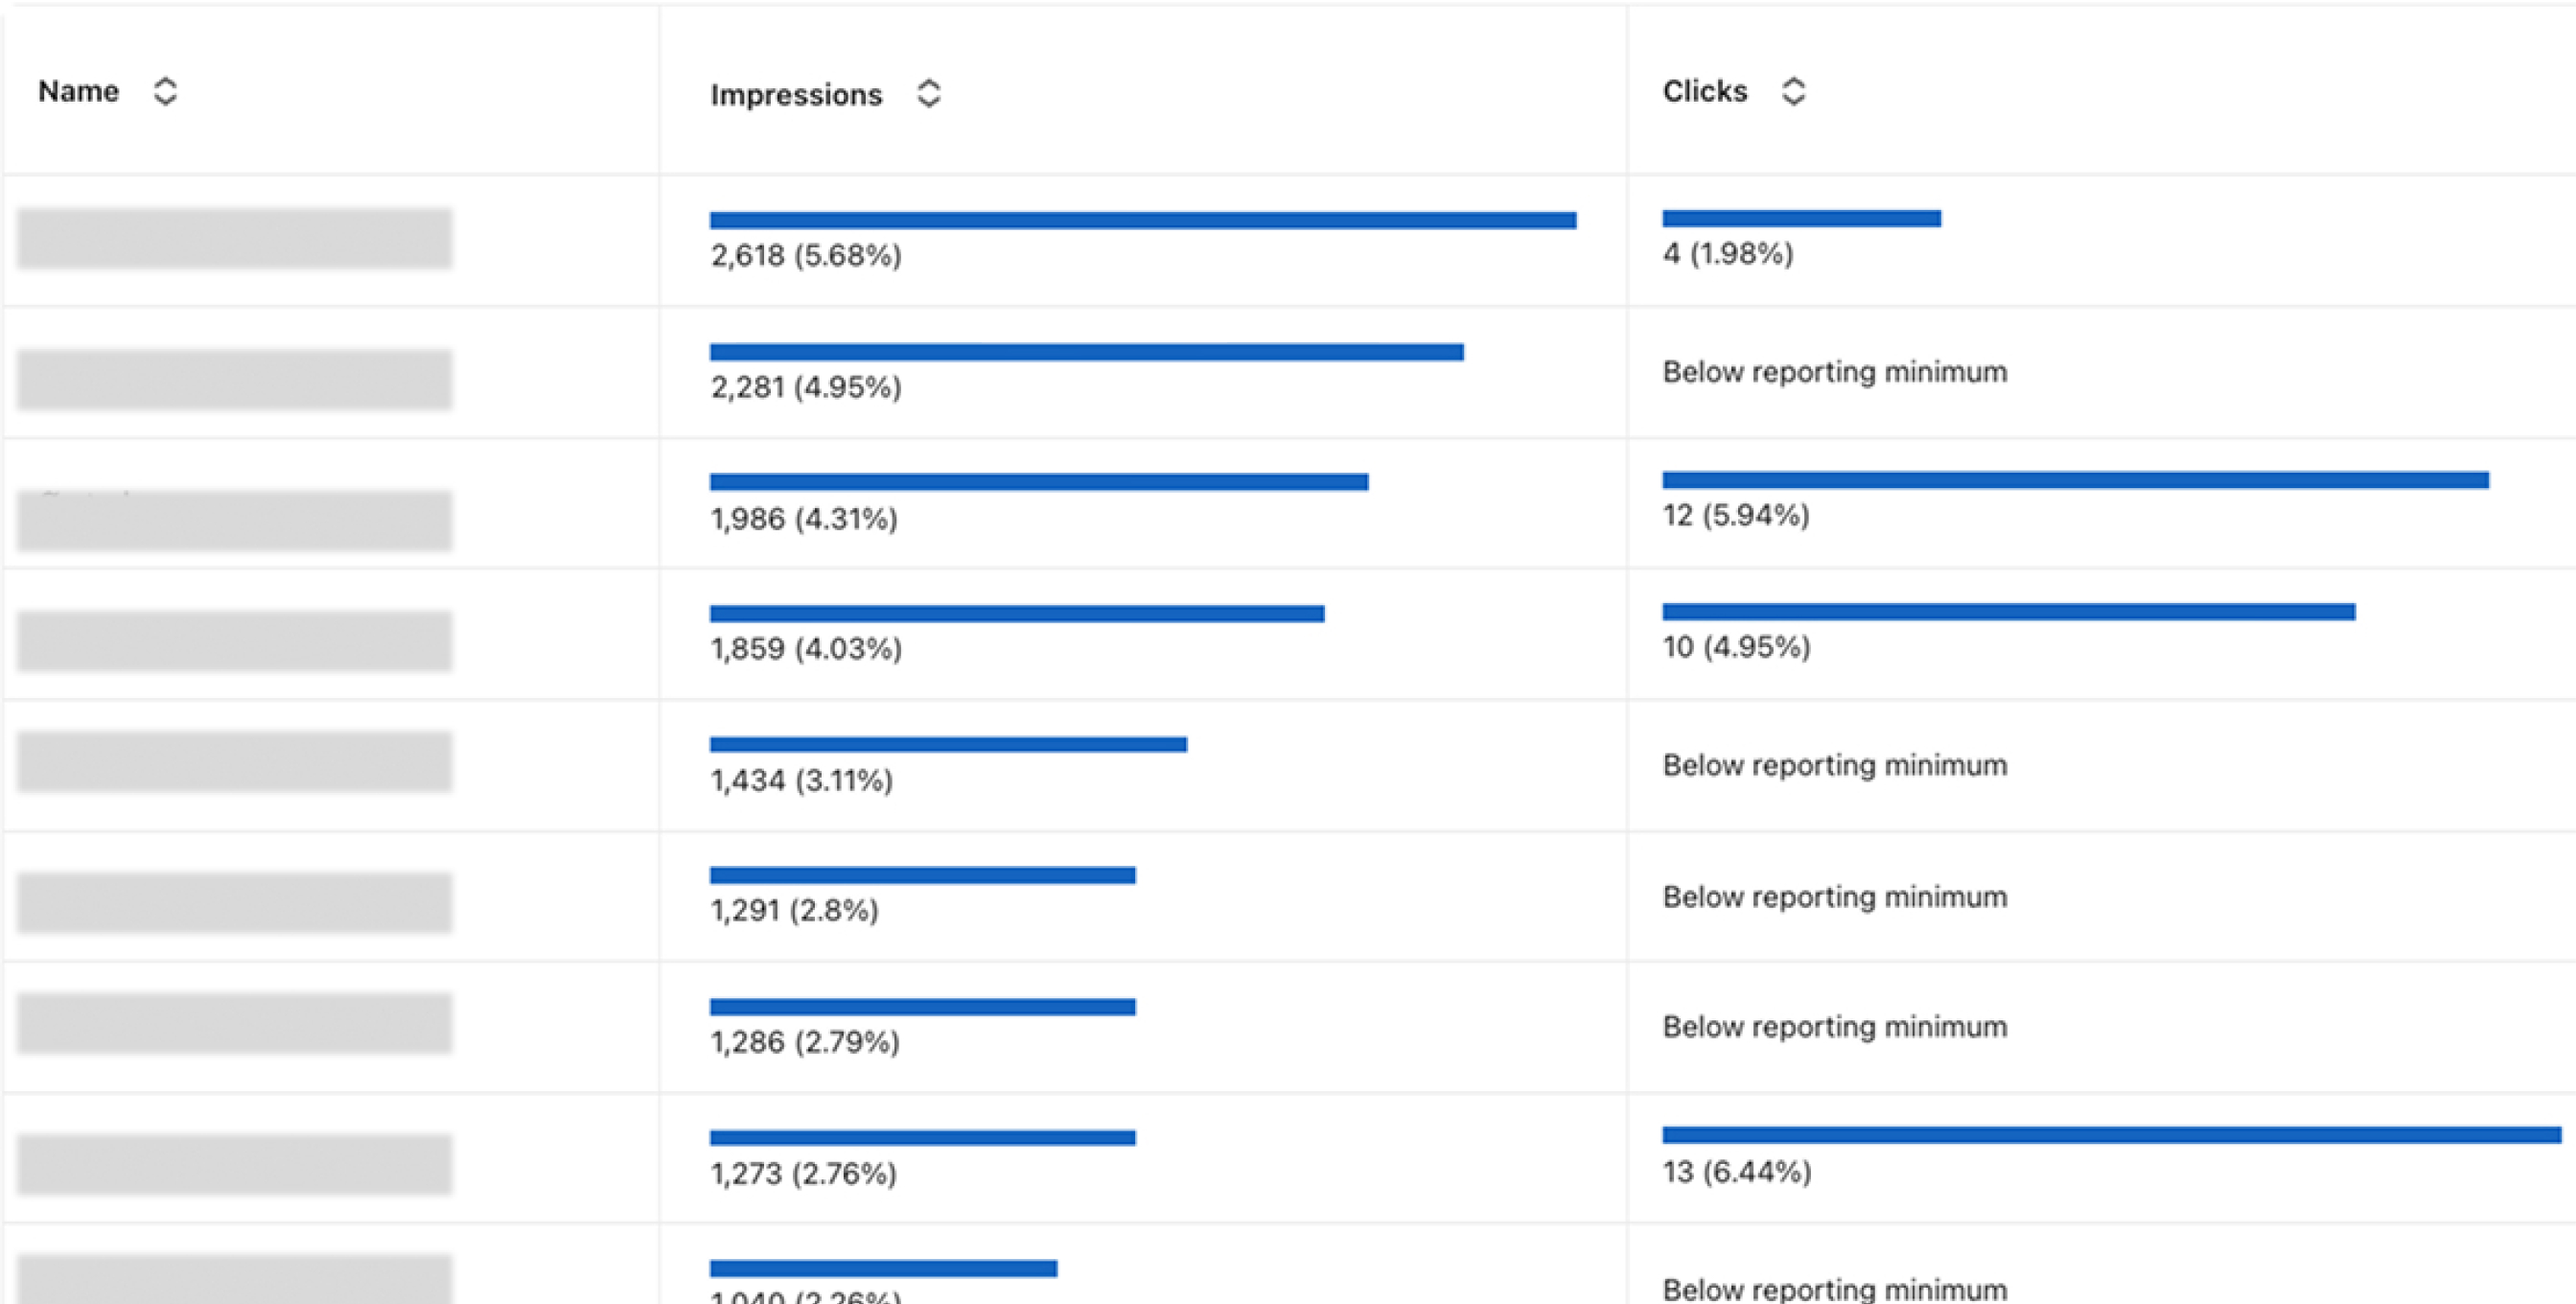
The agent does this automatically and builds a dataset containing:
- Company name
- Week of the year (or whatever timeframe you choose)
- Number of ad impressions
Step 2 - Pull HubSpot Deals with Timestamps
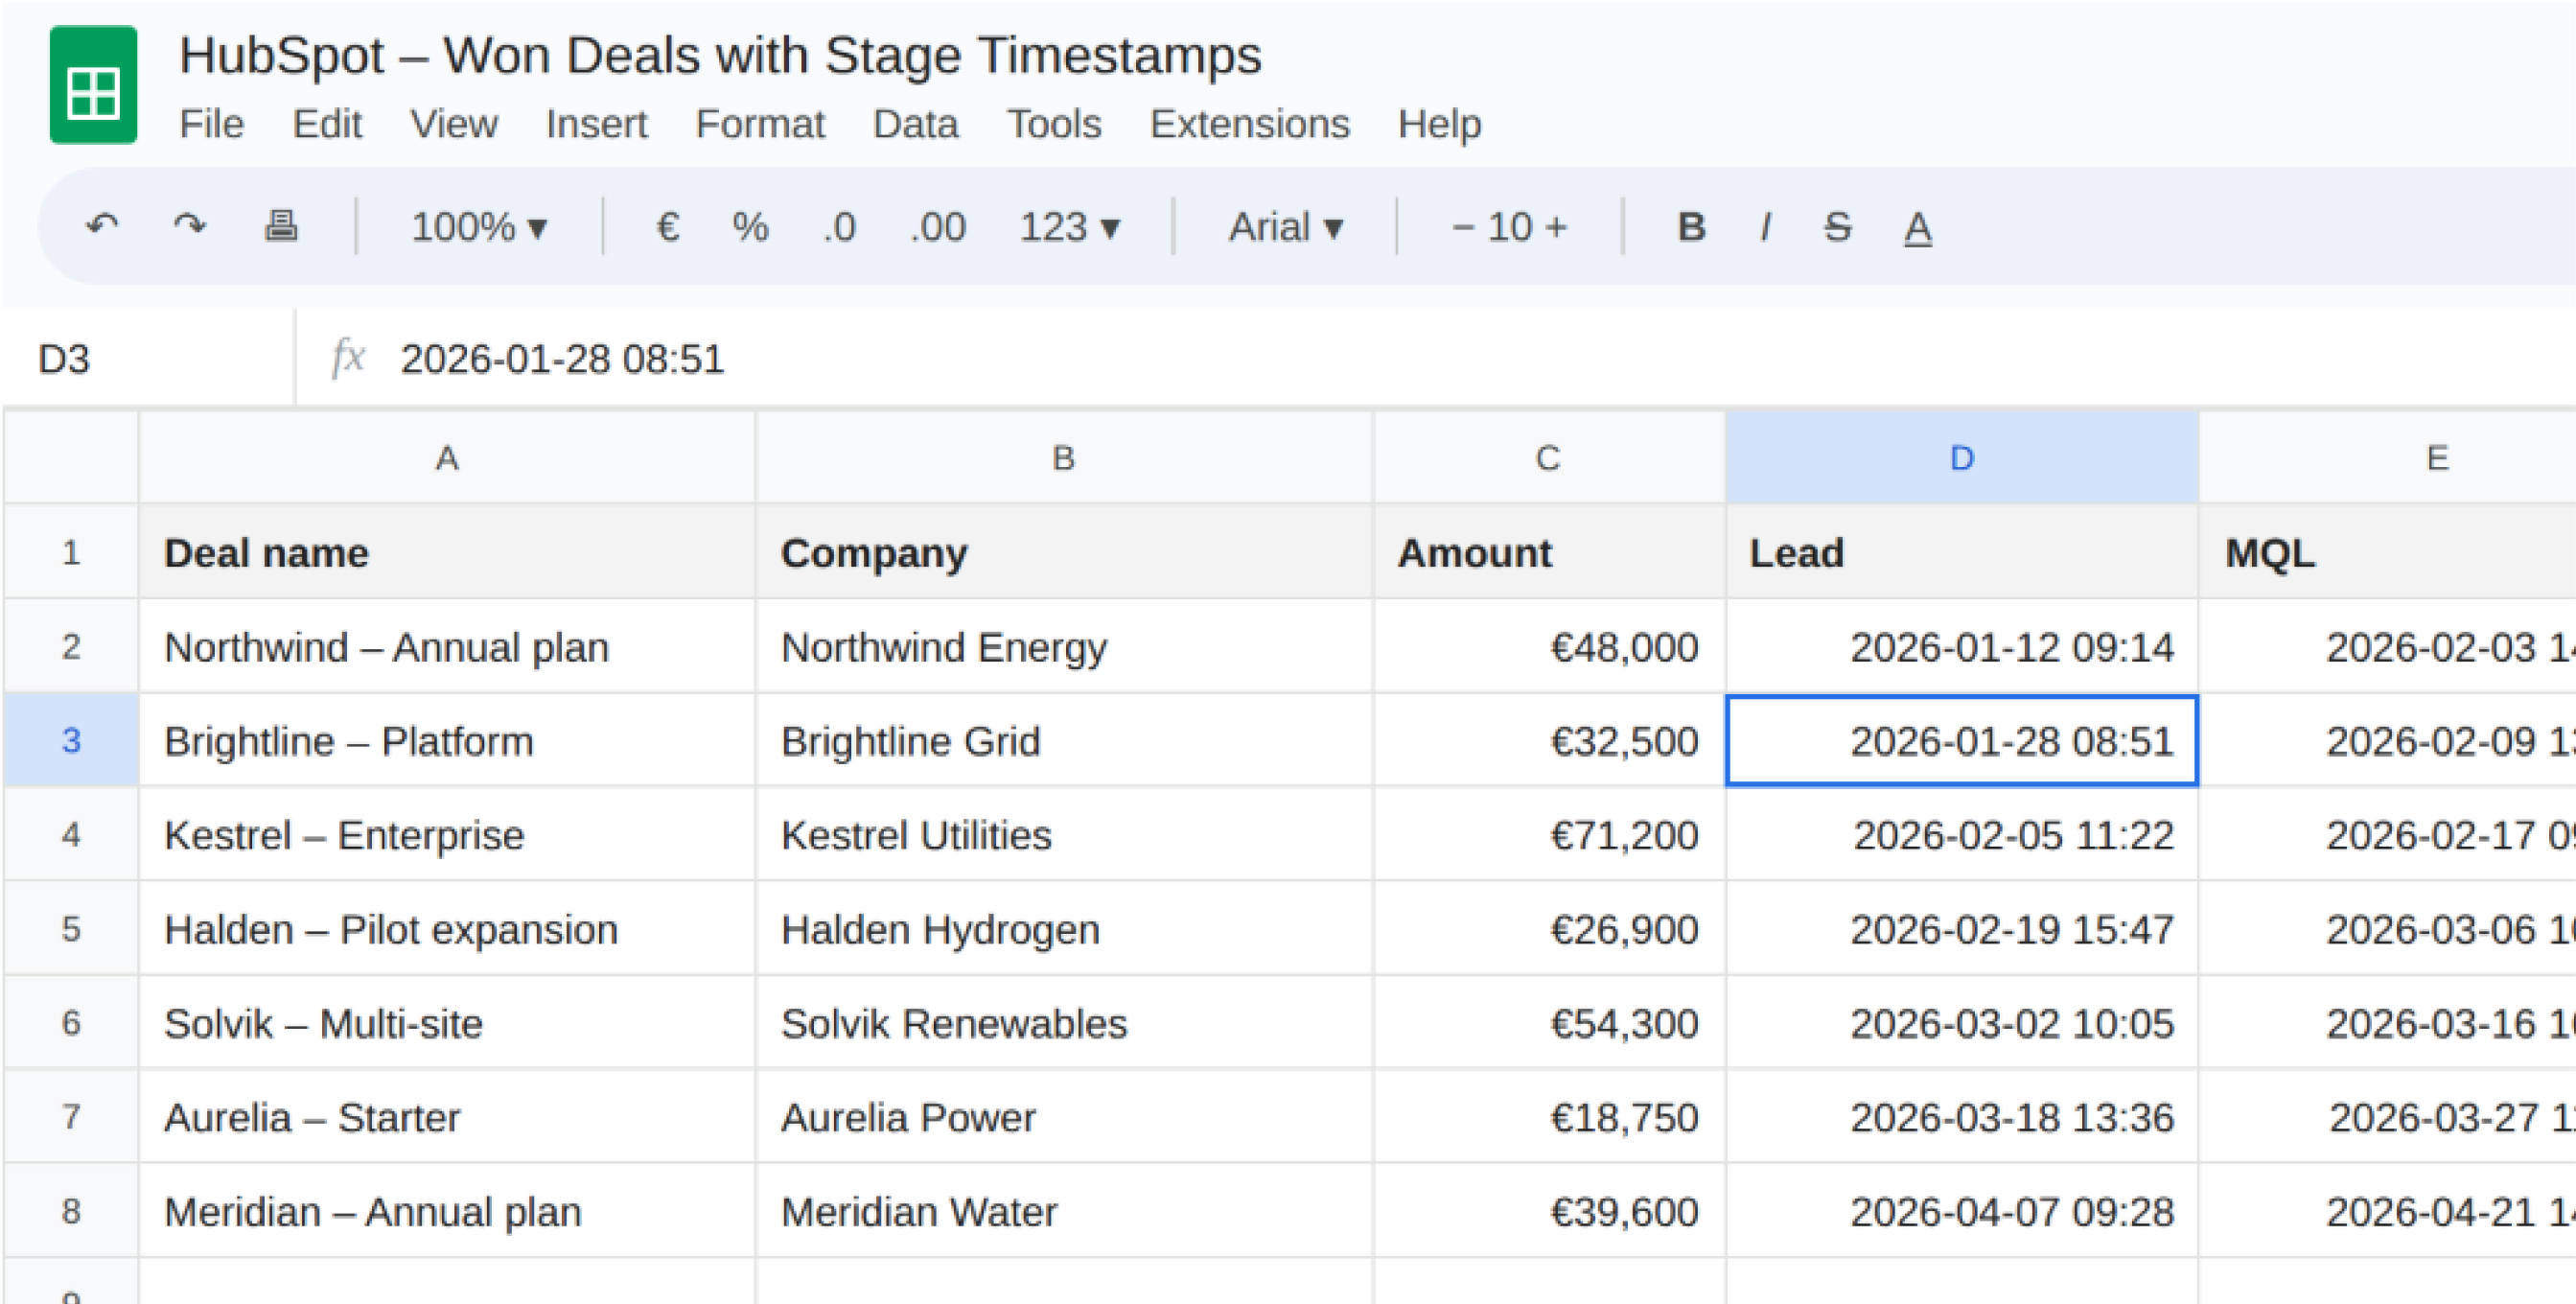
The second dataset we want is the deal data from HubSpot, including the timestamp for each stage.
The agent connects to HubSpot, pulls in your won deals, and checks the company name for each deal, along with the dates when the deal changed stages.
Step 3 - Match the Two Datasets
Now, what do you do with these two tables?
I like to combine them into a timeline. In each row, I want to see ad exposure over time, along with a marker showing when a company entered the pipeline or changed stages.
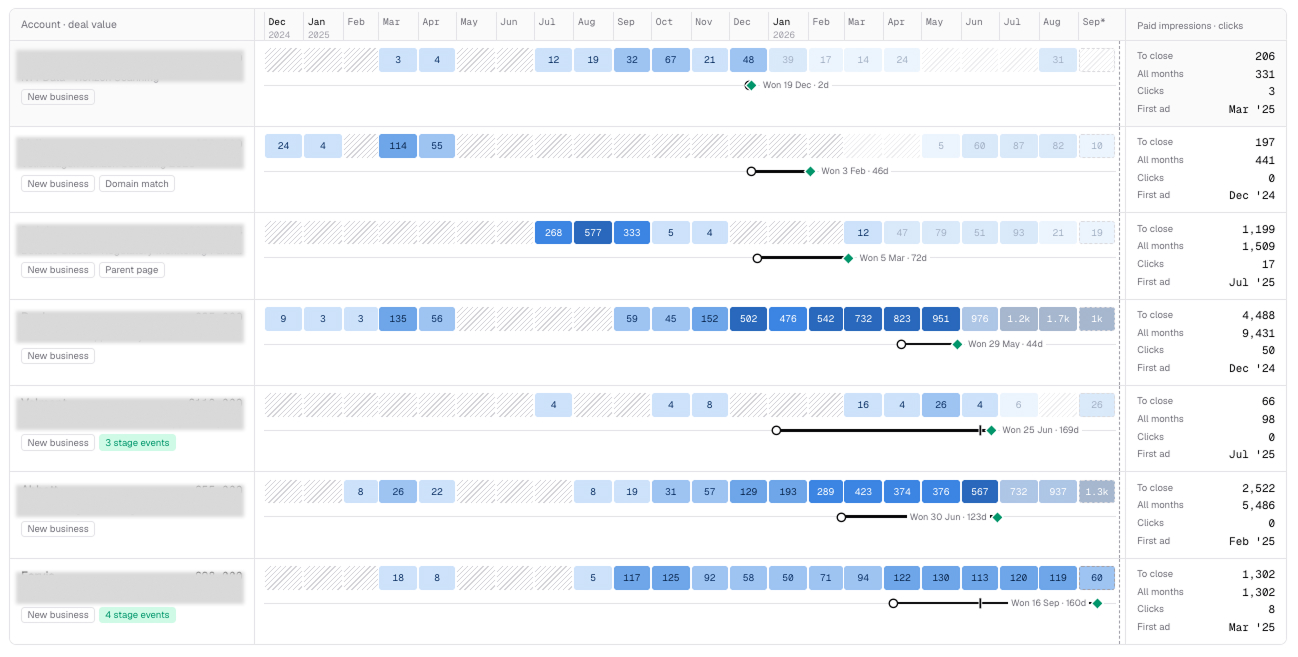
So, are your ads effective even if the CTR is low and there are few conversions?
This report allows you to flip the question:
This company entered our pipeline after seeing our ads 34 times a week for two quarters. Is that just by chance?
Spoiler: Nope 😎